Data Collaboration
This was a workshop we did in order to create a display of collaborated data also enabling others to participate and add there own data creating a visually stimulating display. The aim of this exercise was to design a creative, collaborative design using data we had collected.
We started this exercise by collecting data from our homes over a 24 hour period. We recorded the data of all the electrical appliances that we used, we recorded what the appliance was, how long we used them for within the whole day and what the wattage was of the object.
We were split into small groups where we gathered all our data together. We began to sketch and write down a few ideas of ways in which we could present our data. We had many ideas however the one we decided would work the best and decided to expand on was a large clock.
We immediately thought of a clock as it was part of the main factor we had recorded - Time.
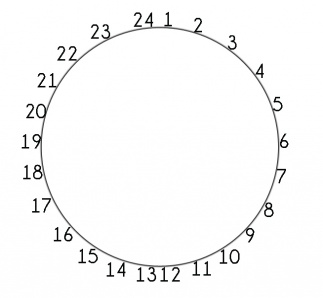
We drew a large circle on the wall and began to number it. We soon realized that rather than numbering the clock from 1 - 12 it would be a clearer way to display the data if it was a 24 hour clock so, we numbered one half 1-12 and the other half 13-24.
As we all had different appliances within our homes we decided to focus on the main ones which we all had which were; Television, Phone, Lights and Sky Box. Searching on the internet we found an average energy consumption used for the 4 appliances we did this as we thought about how others would add there data if they had not recorded the wattage of their appliances. We put this information on the wall beside our clock, we also chose a colour for each appliance and made a key.
In our clock we drew 4 smaller circles within it. We labelled these with a range of wattage from 25- 400. The way we chose to apply our data to our clock was to start from the centre with the coloured string for the appliance and record the wattage and the time that it was used for. For example, my data for my telephone began at the centre, the first pin I used was pinned onto the 200W circle at 10:30am when I began watching the television. My second pin went on the same circle at 12:14pm when I stopped watching the television. The string went from the centre to and around my first pin, then around my second pin and back to the centre. I repeated this for my evening data aswell, we each continued this process for all our recorded data using the different colours to interpret the different appliances.
The Images show what our collaboration looked like after we had added all our data. We then
This is the end result of what our collaborative data looked like. It created a really effective outcome especially with the string overlapping each other. I think it was a really successful outcome. Creating a visually stimulating display of data.
Data Collaboration
Once we had completed adding our data as a group we went to another groups work to see if we could work out how they had collaborated their data without any instructions as to what they had done. The one that we were looking at they had created symbols/images to represent the appliance. They had a lot of different colours of string continuously wrapped around the shapes. The pieces of string eventually stopped and the string was left hanging which each group member had labelled. We then noticed that each member had their own colour which they had used to determine their data. From what we could gather with no information we thought that there concept was to add up the total of the data usage for the whole 24 hours and go around the appliance shape once with the string for every hour. We began to collaborate our data into their design. Going around and around the shapes it began to be abit boring so as we could expand and collaborate on the design I decided to add my phone, pc and light usage up altogether and went around all three shapes as you can see in the image to the right there is string that goes all around and connects the appliances together. We also decided to incorporate a telephone as we all had this within our data. This design created a beautiful blend of colours from all the colours of string layered over and over.